Smile, You’ve Got Big Data: Why You Need Business Intelligence

When it comes to ecommerce, retail savvy is no longer enough. You also need business intelligence (BI for short). Basically, BI takes all of the raw data generated by your ecommerce enterprise, analyzes and digests it, then spits out the information you need to make better, more informed decisions about marketing, sales, and other aspects of your ecommerce business.
Luckily for you, there’s an app for that. Specifically designed for ecommerce storeowners, PayHelm provides real-time analytics for your online retail business, translating customer info and sales data into reports that enable you to make decisions based on facts, not guesswork. A survey by Helical IT found that decisions made using facts had a 79% greater chance of success than decisions made via intuition
In fact, your ecommerce business is probably already generating, tracking, and aggregating the essential information you need to help it thrive and grow. Nowadays, even small and medium-sized businesses are producing mountains of big data, but there’s gold in them thar hills — if you know how to extract it.
According to a study by Nucleus Research, for every $1 a company spends on BI, it makes $10.66. That’s an ROI of more than 1000%! Furthermore, companies that make extensive use of customer data analytics in their business decisions see 126% profit improvement compared to companies that don’t use BI. So it literally pays to take advantage of the insights gleaned via business intelligence.
Best of all, BI can lead to higher sales and more satisfied repeat customers. Why? Because business intelligence can help you to better understand your customers and the market, highlight trends, and spot potential problems before they turn into pitfalls.
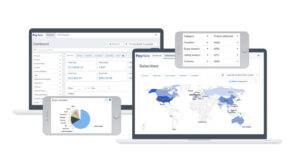
That’s where PayHelm comes in. This multifunctional BI tool crunches data as fast as it comes in. Then it makes analyses of that data available in various forms and formats, including charts and graphics that visually reveal trends and patterns.
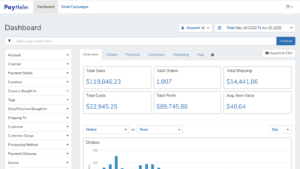
A dashboard serves as Information Central, displaying and managing essential metrics such as key performance indicators (KPIs) and other relevant data points that help monitor the overall health of your ecommerce business. From there, you can drill down to the details that matter most.
In addition, ad hoc reporting enables the creation of dynamic, real-time data reports on an as-needed basis. These ad hoc reports are designed to answer a specific business question, usually in response to an event. Want to find out how well your last promotion did (or didn’t)? PayHelm can tell you with just a few clicks.
Speaking of marketing, business intelligence can break down your customer base into groups with similar characteristics. These groups are known as cohorts. BI uses cohort analysis to understand the trends and patterns of customers over time in order to better tailor the products offered to various cohorts along with helping to predict what new product(s) will be most likely to sell well.
Cohort analysis is very helpful in evaluating the results of your marketing efforts. It can also tell you which groups of customers are driving the most revenue.
Another major concern for ecommerce businesses is customer retention and its flip side, churn (a.k.a. customer attrition). Typically, for small and medium-sized businesses, 3%-5% is considered to be a “good” churn rate.
To calculate your business’ churn rate, take the number of customers you lost last quarter and divide it by the number of customers with which you started. To determine the lifespan of your average customer, divide 1 by your churn rate.
BI software like PayHelm can help you predict churn and even suggest ways to combat it.
Here are some more examples of the statistical gold that PayHelm can mine from your motherlode of ecommerce data:
- Performance metrics reveal your business’ actions, abilities, and overall quality.
- Product analysis – total sales, orders, and average price
- Global sales – analyzed by location
- Product performance – keyword analysis
- Profitability analysis (e.g., how much your business makes from each $1 in sales)
- Trend and problem indicators. Ecommerce KPIs include…
- Average order value
- Conversion rate
- Cost of goods sold
- Gross and net profit
Thinking of adding another sales channel (or channels)? PayHelm can help you there, too; it can analyze various factors across multiple ecommerce platforms, including BigCommerce, Shopify, and PayPal. You can also control user access to data — e.g., who can see what — as well as export, manage, and save your data in CSV format.
PayHelm is here to handle your business needs with its user friendly reports. Your marketing team, accounting team and leadership team will all love being on the same page. Try it now for free.


