PayHelm Partners with WooCommerce to Provide Advanced Reporting for WooCommerce Merchants

Announcing PayHelm for WooCommerce: A Game-Changing Partnership

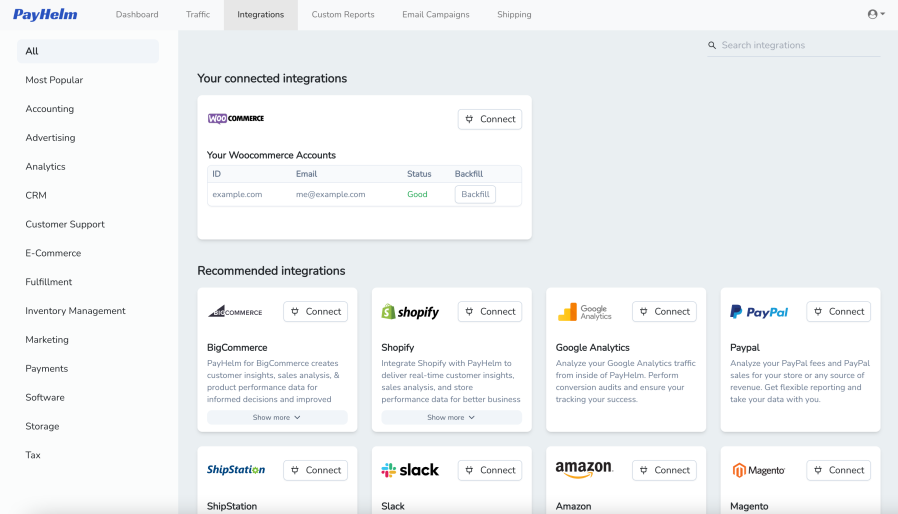
PayHelm is excited to announce its new partnership with WooCommerce, the leading WordPress-based ecommerce platform which helps merchants and developers build successful businesses for the long term. This collaboration brings powerful, customized ecommerce insights directly to WooCommerce merchants, helping them make faster, more informed decisions to grow their businesses.

The PayHelm extension for WooCommerce offers a comprehensive data analytics and reporting dashboard, providing merchants with a unified view of their store’s performance. From sales and inventory to marketing and logistics, every aspect of the business is captured and analyzed. The extension also integrates seamlessly with dozens of third-party platforms like Google Ads, PayPal, Klaviyo, and more, ensuring a data-rich experience.

Unlock the Power of Your WooCommerce Data

With PayHelm’s integration, WooCommerce merchants gain access to over 300 pre-built reports and intuitive dashboards. These insights empower businesses to understand their customers better, optimize their operations, and boost sales and order volume.

“We’re thrilled to partner with the PayHelm team to provide merchants with powerful, easy-to-use analytics tools that will help them gain deeper insights into their business,” said De Wet Huysamer, Senior Director of Strategic Partnerships at WooCommerce. “This collaboration aligns perfectly with our efforts to help businesses unlock the power of their data to grow sales, tap into new customers, and improve overall efficiency.”

Andrew E.R. Sukow, CEO of PayHelm, added, “Partnering with WooCommerce allows us to provide merchants with comprehensive data insights and powerful marketing analytics. Together, we’re helping businesses turn their store data into actionable strategies that drive performance and growth.”

This collaboration marks a new era of data-driven decision-making for WooCommerce merchants, enabling smarter, faster, and more efficient ecommerce operations.

Walmart Marketplace Analytics: Connecting Your Walmart Store to PayHelm

Introduction

In the rapidly evolving world of e-commerce, staying ahead of the competition means having the right tools at your disposal. For sellers on the Walmart Marketplace, understanding your store’s performance across various channels can be challenging but crucial. One powerful solution to streamline this process is PayHelm, a comprehensive analytics tool that offers invaluable insights into your Walmart store’s performance. We’ll explore how connecting your Walmart store to PayHelm can help you better understand your store performance across all your channels.

Understanding Walmart Marketplace

Walmart Marketplace is a rapidly growing platform that allows third-party sellers to list their products on Walmart’s website. As a seller, leveraging this platform can open up new opportunities for growth and expansion. However, managing your store effectively requires detailed insights into your sales, inventory, and customer behavior. This is where PayHelm comes into play.

What is PayHelm?

PayHelm is an advanced analytics and reporting tool designed specifically for e-commerce businesses. It integrates seamlessly with multiple sales channels, including Walmart Marketplace, to provide a comprehensive view of your business performance. By connecting your Walmart store to PayHelm, you gain access to a wealth of data that can help you make informed decisions, optimize your operations, and ultimately boost your sales.

The Benefits of Connecting Your Walmart Store to PayHelm

Centralized Data Management

One of the primary benefits of using PayHelm is its ability to centralize your data. Instead of juggling multiple spreadsheets or logging into different platforms to gather your sales data, PayHelm consolidates everything into one easy-to-use interface. This centralized data management saves time and reduces the risk of errors, allowing you to focus on growing your business.

Comprehensive Sales Analytics

PayHelm provides detailed sales analytics that can help you understand your store’s performance on the Walmart Marketplace. You can track key metrics such as total sales, average order value, and conversion rates. Additionally, PayHelm allows you to analyze sales trends over time, identify your best-selling products, and uncover patterns in customer behavior.

Inventory Management

Effective inventory management is crucial for maintaining a healthy cash flow and ensuring customer satisfaction. PayHelm helps you monitor your inventory levels in real-time, alerting you when stock is running low or when certain products are not performing as expected. This proactive approach to inventory management can help you avoid stockouts and overstock situations, optimizing your inventory turnover and reducing holding costs.

Multi-Channel Insights

For sellers who operate on multiple e-commerce platforms, having a tool that provides insights across all channels is invaluable. PayHelm allows you to compare your Walmart store’s performance with other sales channels, such as Amazon, eBay, or your own website. This multi-channel perspective can help you identify which platforms are driving the most revenue, where your marketing efforts are paying off, and where there may be opportunities for improvement.

Customizable Reports and Dashboards

PayHelm offers customizable reports and dashboards that can be tailored to your specific business needs. Whether you need a high-level overview of your store’s performance or detailed reports on specific metrics, PayHelm provides the flexibility to create and save custom reports. This ensures that you have access to the information you need, when you need it.

Enhanced Decision-Making

With access to accurate and up-to-date data, you can make more informed decisions about your business. PayHelm’s analytics can help you identify underperforming products, optimize your pricing strategy, and allocate your marketing budget more effectively. By leveraging data-driven insights, you can take actions that are more likely to result in positive outcomes for your business.

How to Connect Your Walmart Store to PayHelm

Getting started with PayHelm is a straightforward process. Here are the steps to connect your Walmart store:

  1. Sign Up for PayHelm: If you haven’t already, create an account on PayHelm’s website.
  2. Connect Your Walmart Store: Follow the instructions to link your Walmart store to PayHelm. This typically involves entering your Walmart Marketplace API credentials.
  3. Sync Your Data: Once your store is connected, PayHelm will begin syncing your sales and inventory data. This process may take some time, depending on the volume of data.
  4. Explore Your Dashboard: After the initial sync, you can start exploring your PayHelm dashboard. Customize your reports and dashboards to suit your business needs and start analyzing your store’s performance.

Tips for Maximizing the Benefits of PayHelm

To get the most out of PayHelm, consider the following tips:

  • Regularly Review Your Reports: Set aside time each week or month to review your PayHelm reports. Regularly monitoring your performance can help you spot trends and take corrective action quickly.
  • Utilize Custom Alerts: Set up custom alerts to notify you of important changes in your store’s performance, such as a sudden drop in sales or low inventory levels. This can help you respond to issues promptly.
  • Experiment with Different Metrics: PayHelm offers a wide range of metrics and reports. Experiment with different combinations to uncover insights that might not be immediately obvious.
  • Integrate with Other Tools: If you use other e-commerce tools, consider integrating them with PayHelm for a more comprehensive view of your business. PayHelm supports integrations with various platforms, enhancing its capabilities.

Conclusion

In today’s competitive e-commerce landscape, having the right tools to analyze and understand your store’s performance is essential. With features like centralized data management, comprehensive sales analytics, and customizable reports, PayHelm empowers you to take control of your Walmart Marketplace performance and succeed across all your sales channels. Investing in a robust analytics tool like PayHelm is not just a smart business move; it’s a necessary step towards achieving long-term success in the ever-evolving world of e-commerce. Start leveraging the power of PayHelm today and unlock the full potential of your Walmart store.

Boosting Your Business with Google Ads and PayHelm Pixel: Achieving Clear Attribution and Enriched Customer Insights

Introduction

In the modern digital marketplace, businesses are constantly seeking ways to optimize their marketing strategies and maximize their return on investment (ROI). Google Ads stands out as a powerful tool for online advertising, offering extensive reach and advanced targeting options. However, one persistent challenge for marketers is accurately attributing conversions to the right channels. This is where PayHelm Pixel comes into play. When combined with Google Ads, PayHelm Pixel offers precise attribution and enriches your understanding of your top customers through first-party data, transforming your marketing efforts.

Understanding Google Ads and Attribution Challenges

Google Ads has revolutionized digital advertising, enabling businesses to reach potential customers with targeted ads based on search queries, browsing behavior, and demographic information. This platform’s ability to deliver ads to highly specific audiences has made it a cornerstone of many businesses’ marketing strategies.

Introducing PayHelm Pixel

PayHelm Pixel is an advanced tracking tool designed to capture detailed customer interaction data across your website. Unlike traditional tracking pixels, PayHelm Pixel provides enhanced capabilities, including granular data capture and seamless integration with other marketing tools. This makes it an invaluable asset for businesses aiming to gain deeper insights into customer behavior and improve attribution accuracy. By tracking every click, hover, and form submission on your website, PayHelm Pixel offers a comprehensive view of user interactions, enabling precise attribution and better understanding of customer journeys.

The Synergy of Google Ads and PayHelm Pixel

When Google Ads is combined with PayHelm Pixel, businesses can achieve a level of attribution clarity that is otherwise difficult to obtain. Here’s how this powerful combination enhances marketing efforts:

Enhanced Data Capture

PayHelm Pixel goes beyond basic tracking by capturing detailed interaction data. This data, when linked with Google Ads campaigns, reveals which ads are not just driving clicks, but leading to meaningful interactions and conversions. This level of detail helps businesses identify the most effective ads and optimize their campaigns for better performance.

First-Party Data Enrichment

One of the standout benefits of PayHelm Pixel is its ability to enrich your first-party data. First-party data, collected directly from your customers, is invaluable because it is accurate and privacy-compliant. By integrating this data with Google Ads campaigns, businesses can build detailed customer profiles that highlight their top customers and their preferences. This enriched data enables more personalized and effective remarketing campaigns, as well as improved customer segmentation. With a deeper understanding of customer behavior, businesses can tailor their marketing efforts to better meet customer needs and drive higher engagement.

Clear Attribution Paths

With PayHelm Pixel, the attribution path from ad click to conversion is clearly mapped out. This clarity comes from the pixel’s ability to track detailed user interactions across multiple sessions. For instance, if a customer clicks on a Google Ad, browses your website, leaves, and then returns via a different channel before making a purchase, PayHelm Pixel can attribute the conversion appropriately, considering all touchpoints. This multi-touch attribution model ensures that each channel involved in the customer journey gets the credit it deserves, providing a holistic view of the effectiveness of your marketing efforts.

The Benefits of Clear Attribution and Enriched Data

Combining Google Ads with PayHelm Pixel offers several significant benefits that can transform your marketing strategy and improve your business outcomes like the following :

Improved ROI

Clear attribution helps allocate marketing budgets more effectively, ensuring that resources are spent on the most profitable campaigns. By understanding which ads and keywords are driving the most conversions, businesses can focus their efforts on high-performing strategies and eliminate underperforming ones. This targeted approach leads to a better return on investment, maximizing the impact of your marketing spend.

Better Customer Insights

Enriched first-party data provides a deeper understanding of customer behavior, enabling more effective targeting and personalized marketing efforts. By analyzing detailed interaction data, businesses can identify trends and preferences among their top customers, allowing for more tailored marketing messages and offers. This personalized approach not only enhances customer engagement but also fosters loyalty and increases the likelihood of repeat business.

Enhanced Campaign Performance

Detailed data on user interactions allows for continuous optimization of ad creatives, keywords, and targeting strategies. With clear insights into which elements of your campaigns are performing well, you can make informed adjustments to improve overall campaign effectiveness. This iterative process of testing and optimization ensures that your marketing efforts remain relevant and impactful, driving better results over time.

Real-World Success Stories

Numerous businesses have seen transformative results by combining Google Ads with PayHelm Pixel. For example, an e-commerce company specializing in custom apparel saw a 30% increase in conversion rates after implementing PayHelm Pixel. By accurately tracking customer journeys and enriching their first-party data, they were able to identify their most profitable customer segments and tailor their marketing strategies accordingly. This targeted approach not only boosted conversions but also improved customer satisfaction and loyalty.

Similarly, a B2B software company improved their lead generation by 25% by using PayHelm Pixel data to refine their Google Ads targeting. By understanding which ads led to high-quality leads, they could focus their budget on the most effective keywords and ad creatives. This resulted in a higher volume of qualified leads and ultimately, increased sales.

Maximizing Your Marketing Efforts

In the fast-paced world of digital marketing, having clear attribution and enriched customer insights is essential for staying ahead of the competition. By combining the power of Google Ads with PayHelm Pixel, businesses can achieve unparalleled clarity in their marketing efforts. This potent combination not only improves ROI but also provides a deeper understanding of customer behavior, enabling more targeted and effective marketing strategies.

The implementation of PayHelm Pixel with Google Ads provides businesses with the tools needed to understand precisely how ads are performing, enriches first-party data for better customer insights, and ultimately drives business growth. With enhanced data capture, enriched customer profiles, and clear attribution paths, businesses can optimize their marketing strategies and achieve better results.

Conclusion

For businesses looking to maximize their online advertising efforts, integrating PayHelm Pixel with Google Ads is a game-changer. This powerful combination offers precise attribution and enriched data, providing a comprehensive view of customer interactions and enabling more effective marketing strategies. By leveraging the detailed insights gained from PayHelm Pixel, businesses can optimize their ad campaigns, improve customer targeting, and ultimately, drive higher conversions and ROI.

Take the step today to experience the transformative. Add the power of clear attribution and enriched data with Google Ads and PayHelm Pixel. Embrace this powerful combination to boost your business, enhance your marketing efforts, and achieve sustained growth in the competitive digital landscape.

Maximizing Business Performance with OpenAI and PayHelm Integration

Introduction

Maximizing Business Performance with OpenAI and PayHelm Integration

In today’s fast-paced digital economy, data is not just a buzzword; it’s a critical asset. For businesses, the ability to harness data effectively can determine success or failure. This is where the powerful combination of OpenAI’s ChatGPT and PayHelm comes into play. By integrating ChatGPT with PayHelm, business owners can gain unparalleled insights into their operations, driving strategic decisions and fostering growth. In this we’ll explore how this integration can provide key insights into your business performance and help you make data-driven decisions.

Understanding OpenAI’s ChatGPT

OpenAI’s ChatGPT is a state-of-the-art language model that can comprehend and generate human-like text based on the input it receives. Trained on a diverse dataset, it can perform various tasks, including answering questions, summarizing information, translating languages, and much more. For businesses, ChatGPT is a versatile tool that can enhance customer service, streamline content creation, and provide valuable data analysis.

Introduction to PayHelm

PayHelm is an advanced analytics platform tailored for e-commerce businesses. It offers detailed reports and visualizations of crucial metrics such as sales data, customer behavior, and inventory levels. PayHelm integrates seamlessly with popular e-commerce platforms like Shopify, WooCommerce, and Magento, making it an indispensable tool for online retailers. By aggregating data from different sources, PayHelm enables business owners to understand their performance intricately and make informed decisions.

The Power of Integration

Combining the analytical prowess of PayHelm with the linguistic capabilities of ChatGPT can revolutionize how businesses analyze and utilize their data. Here’s why this integration is a game-changer:

  1. Enhanced Data Interpretation: While PayHelm provides comprehensive analytics, interpreting this data into actionable insights can be challenging. ChatGPT can translate complex data into plain language summaries, highlight key trends, and suggest strategic actions based on the data. This makes data interpretation accessible and practical for business owners and managers.
  2. Automated Reporting: Generating regular business reports can be time-consuming. ChatGPT can automate this process by pulling data from PayHelm and creating detailed weekly or monthly performance summaries. This ensures consistency and saves valuable time, allowing you to focus on strategic initiatives.
  3. Improved Customer Insights: Understanding customer behavior is crucial for tailoring marketing strategies and improving customer retention. ChatGPT can analyze customer data from PayHelm, identifying patterns and trends that might not be immediately apparent. This deepens your understanding of customer preferences and helps enhance overall satisfaction.
  4. Predictive Analytics: By combining ChatGPT’s natural language processing capabilities with PayHelm’s historical data, businesses can leverage predictive analytics. This enables you to forecast future trends, anticipate sales fluctuations, and plan inventory more effectively, thus staying ahead of the market curve.
  5. 24/7 Business Monitoring: ChatGPT can be set up to monitor significant changes or anomalies in your data around the clock. This ensures you’re always informed about critical issues, even outside regular business hours, allowing for prompt responses to potential problems.

Automated Sales Reports

Imagine receiving a detailed sales report every Monday morning that summarizes the past week’s performance. ChatGPT can pull data from PayHelm to generate comprehensive reports, including metrics such as total sales, average order value, top-selling products, and customer acquisition costs. This automation not only saves time but also ensures that you have up-to-date information at your fingertips.

Customer Behavior Analysis

Understanding your customers’ behavior is essential for effective marketing and product development. By analyzing data from PayHelm, ChatGPT can identify trends and patterns in customer behavior, such as peak shopping times, popular products, and common purchase pathways. These insights can inform your marketing strategies, helping you target customers more effectively and increase conversion rates.

Inventory Management

Maintaining optimal inventory levels is critical for any e-commerce business. ChatGPT can analyze sales data from PayHelm to predict future demand for your products, helping you avoid stockouts and overstock situations. This ensures that you always have the right amount of inventory on hand and can meet customer demand efficiently. Additionally, ChatGPT can alert you to low stock levels and recommend reordering times.

Personalized Customer Service

ChatGPT can enhance your customer service by providing personalized responses based on customer data from PayHelm. For instance, it can help customer service representatives quickly access information about a customer’s purchase history, preferences, and past interactions. This enables more personalized and efficient service, leading to higher customer satisfaction and loyalty.

Marketing Campaign Optimization

Running successful marketing campaigns requires continuous optimization based on data insights. ChatGPT can analyze the performance of your marketing campaigns using data from PayHelm, identifying what works and what doesn’t. This allows you to adjust your strategies in real-time, maximizing the return on your marketing investment. Whether it’s refining your target audience, tweaking your messaging, or reallocating your budget, these insights can significantly enhance your campaign effectiveness.

Transforming Business Strategy

The integration of ChatGPT with PayHelm doesn’t just offer operational benefits; it can also transform your overall business strategy. Here’s how:

  1. Strategic Decision Making: With enhanced insights and automated reporting, you have a clearer understanding of your business performance. This empowers you to make strategic decisions based on accurate, real-time data.
  2. Resource Optimization: By automating routine tasks such as report generation and data analysis, you can optimize resource allocation. Your team can focus on high-value activities such as strategy development and customer engagement.
  3. Competitive Advantage: In the competitive world of e-commerce, having access to deep insights and predictive analytics can give you an edge. You can stay ahead of market trends, anticipate customer needs, and respond proactively to changes in the business environment.
  4. Scalability: As your business grows, the volume of data increases exponentially. The integration of ChatGPT with PayHelm ensures that you can scale your data analytics capabilities seamlessly. Whether you’re expanding your product range, entering new markets, or increasing your customer base, this integration can support your growth.

Conclusion

Integrating OpenAI’s ChatGPT with PayHelm offers a powerful way to enhance your business analytics and decision-making processes. By combining the advanced natural language processing capabilities of ChatGPT with the comprehensive data analytics provided by PayHelm, you can gain deeper insights into your business performance, automate routine tasks, and make more informed decisions.

Whether you’re looking to improve customer service, optimize inventory management, or run more effective marketing campaigns, this integration provides the insights and automation you need to succeed. Embrace the power of AI and data analytics to take your business to new heights.

By leveraging these cutting-edge technologies, you not only stay ahead of the competition but also pave the way for sustained growth and success in the dynamic world of e-commerce. Start exploring the potential of ChatGPT and PayHelm today, and unlock new possibilities for your business. The future of business intelligence and performance optimization lies in the seamless integration of AI and data analytics, and with ChatGPT and PayHelm, you’re perfectly positioned to capitalize on this trend.

Custom Columns, Calculations & Reports

Introducing Custom Columns in PayHelm

Our custom columns feature offers users a dynamic toolset for crafting unique metrics and incorporating custom calculations into your data analytics. Imagine you’re using our app to analyze your data. With the custom columns feature, you’re not limited to pre-defined metrics or calculations. Instead, you have the freedom to design and implement your own, giving you unparalleled control over how you interpret and utilize your data.

Whether you’re tracking sales performance, monitoring website traffic, or analyzing customer feedback, this feature puts the power in your hands to create metrics that reflect the exact insights you’re seeking. Plus, it’s incredibly intuitive to use, allowing you to seamlessly add, edit, and manage your custom columns.

By incorporating custom columns into your data analysis workflow, you’re not just crunching numbers – you’re crafting a tailored approach that aligns perfectly with your unique business objectives or personal interests. So, dive in, explore, and unleash the full potential of your data analysis with our custom columns feature.

How to Create Custom Columns in PayHelm

Creating custom columns is a breeze! Just follow these simple steps:

  1. Go to the “Reports” section in PayHelm.
  2. Look for the “Create New Report” option.
  3. Choose “Custom – Order Based” as your report type.
  4. Voila! You’ll find the custom column tab right there, ready for you to craft your unique metrics and calculations.

Once you’ve done that, here’s a few steps to follow to properly configure your custom column definitions:

Define: Conditional (Optional)

If you want to include a condition for your custom calculation, you can specify it using the following format:

[Key] [Comparison Operator] [Value]

or

([Key] [Comparison Operator] [Value]) and ([Key] [Comparison Operator] [Value]) – For Grouping format

Example 1: total_sales > 1000

Example 2: (customer_company == “Google”) and (total_sales > 1000)

Note: When utilizing text or characters as values, it is necessary to enclose them within double quotation marks.

Available keys for conditions:

customer_id, name, customer_email, customer_phone, customer_company, customer_group_name, tax_exempt_category, customer_form_fields, shipping_form_fields, billing_full_address, shipping_full_address, billing_street_address, shipping_street_address, shipping_city, shipping_province, shipping_zip, last_order_date, total_tax, tax_rate, gross_tax_rate, total_costs, gross_margin, merchant_id, grand_total, total_shippings, total_cost_of_refunds, total_store_fees, avg_shipping, total_discounted_orders, total_store_credit_refund, total_shipping_refund, total_refund_tax, net_sales, avg_items_per_order, avg_price, total_items_sold, total_orders, total_sales, total_refunds, total_items_refunded, avg_fulfillment_time, min_fulfillment_time, max_fulfillment_time, total_profit, avg_tax, avg_order, max_sales, min_sales, max_tax, min_tax, max_shipping, min_shipping, max_discount, min_discount

Available comparison operators:

< (less than)

<= (less than or equal to)

> (greater than)

>= (greater than or equal to)

== (equal to)

!= (not equal to)

( and ) (parentheses for grouping expressions)

Define: Calculation (Required)

After specifying the condition (if applicable), proceed to define the calculation expression. Use the following format:

[Key] [Operator] [Value]

([Key] [Comparison Operator] [Value]) and ([Key] [Comparison Operator] [Value]) – For Grouping format

Example 1: total_sales + total_tax

Example 2: total_sales + 20000

Available keys for calculations:

total_tax, tax_rate, gross_tax_rate, total_costs, gross_margin, grand_total, total_shippings, total_cost_of_refunds, total_store_fees, avg_shipping, total_discounted_orders, total_store_credit_refund, total_shipping_refund, total_refund_tax, net_sales, avg_items_per_order, avg_price, total_items_sold, total_orders, total_sales, total_refunds, total_items_refunded, total_profit, avg_tax, avg_order, max_sales, min_sales, max_tax, min_tax, max_shipping, min_shipping, max_discount, min_discount

Available expression operators:

+ (addition)

– (subtraction)

* (multiplication)

/ (division)

% (modulo)

^ (exponentiation)

( and ) (parentheses for grouping expressions)

Available metrics:

Total Tax, Tax Rate, Gross Tax Rate, Total Costs, Gross Margin, Grand Total, Total Shippings, Total Cost of Refunds, Total Store Fees, Average Shipping, Total Discounted Orders, Total Store Credit Refund, Total Shipping Refund, Total Refund Tax, Net Sales, Average Items Per Order, Average Price, Total Items Sold, Total Orders, Total Sales, Total Refunds, Total Items Refunded, Total Profit, Average Tax, Average Order, Maximum Sales, Minimum Sales, Maximum Tax, Minimum Tax, Maximum Shipping, Minimum Shipping, Maximum Discount, Minimum Discount
March Release : Elevate Your Data Analysis with Custom Multi-Column Pivot Reports and Advanced Calculations

Introduction

March marks an exciting milestone in our journey to enhance your data analysis capabilities. We are thrilled to introduce two powerful features: Custom Multi-Column Pivot Reports and Advanced Calculation Capabilities. These new tools are designed to give you unprecedented flexibility and precision in managing and interpreting your data, particularly for e-commerce businesses.

Custom Multi-Column Pivot Reports

Pivot tables are essential for summarizing and exploring large datasets. Traditional single-axis pivot tables can be limiting when dealing with complex data relationships. This is where our custom multi-column pivot reports come into play.

Multi-column pivot reports extend the capabilities of standard pivot tables by allowing you to pivot on multiple columns simultaneously. This means you can organize and analyze your data across several dimensions. For instance, breaking down sales data by region, product line, and sales representative all at once. This multi-dimensional approach makes it easier to spot trends, correlations, and outliers across your dataset, leading to more informed decision-making.

Enhanced Data Visualization

One of the standout features of multi-column pivot reports is enhanced data visualization. With the ability to segment data across various axes, you can create detailed and intricate data breakdowns. This makes it simpler to identify patterns and insights that might be missed with single-axis pivot tables. For example, in a sales analysis scenario, you can view performance by region, product, and sales representative simultaneously. This helps you pinpoint high-performing areas and uncover opportunities for improvement.

Customizability and Dynamic Updates

Customizability is at the heart of our multi-column pivot reports. The intuitive drag-and-drop interface allows you to arrange your columns and rows to suit your analytical needs. This flexibility ensures that you can extract the most relevant insights from your data without being constrained by rigid report structures.

Dynamic updates are another key feature. As your underlying data changes, your reports will automatically update to reflect the latest information. This eliminates the need for manual adjustments and ensures that you are always working with the most current data. Whether you’re tracking sales trends, monitoring financial performance, or analyzing customer behavior, you can trust that your reports are always up-to-date.

Practical Applications

Multi-column pivot reports can be applied across various business scenarios. In sales analysis, you can break down data by region, product line, and sales representative simultaneously. In financial reporting, compare expenses across multiple departments and fiscal periods. For customer insights, segment data based on demographics, purchase history, and engagement metrics to enhance your marketing strategies and improve customer satisfaction.

Getting Started about learning about Advanced Calculations

Performing advanced calculations on your data is crucial for deriving actionable insights. With our new enhancements, you can now incorporate logical comparisons, complex calculations, and stored procedures directly into your analysis workflow. Advanced calculations allow you to go beyond basic arithmetic and delve into sophisticated data manipulations.

For advanced calculations, access the Calculation Editor in the Reports section. Define your calculations using logical comparisons, mathematical formulas, or stored procedure calls. Use the built-in functions and operators to construct your calculations. Apply the calculation to your dataset and observe the results in real-time, making adjustments as necessary to refine your analysis. Incorporate your custom calculations into pivot reports, dashboards, or standalone analyses to enhance your data insights.

Logical Comparisons and Mathematical Calculations

Logical comparisons enable you to create conditional statements within your reports. This is perfect for flagging anomalies, categorizing data, or performing scenario analysis. For instance, you can use IF/THEN logic to highlight transactions that exceed a certain threshold. You can also categorize customers based on their purchasing behavior or simulate different business scenarios to evaluate potential outcomes.

Mathematical calculations provide the tools to execute complex operations directly within your reports. Whether you need to calculate growth rates, weighted averages, or cumulative totals, our robust calculation engine has you covered. This means you can derive precise metrics tailored to your specific business needs.

Stored Procedures and Automation

Stored procedures bring the power of SQL scripting to your fingertips. You can leverage predefined SQL scripts to perform batch updates, complex data transformations, or integrate external data sources. This functionality is particularly useful for automating repetitive tasks, ensuring data consistency, and extending the analytical capabilities of your platform. For instance, automate the process of updating financial data from multiple sources, ensuring your reports are always accurate and up-to-date.

Seamless Integration and Practical Applications

Seamless integration of these advanced calculation tools within our reporting interface ensures a smooth workflow. Apply your calculations without leaving the platform, streamlining your analytical process and maintaining consistency across your analyses. This integration eliminates the need for external tools or manual data manipulation, saving you time and reducing the risk of errors.

Getting Started with Multi-Column Pivot Reports

To start using the multi-column pivot reports, navigate to the Reports section and select the Pivot Report Builder. Begin creating your custom reports by choosing the data fields you want to include. Drag and drop these fields into the desired row and column sections, adjusting the layout as needed. Save your pivot report for future use or share it with your team to collaborate on data analysis.

E-commerce Integration

For those in the e-commerce sector, these tools can be integrated into your existing systems. Whether you are using Shopify, BigCommerce, or Etsy, our multi-column pivot reports and advanced calculations can enhance your analytics capabilities. Generate detailed reports such as the Shopify payout report, BigCommerce sales tax report, and Etsy sales analytics.

Connect and Automate

Integrate your e-commerce dashboards with Slack for real-time updates and notifications. Use tools like Google Analytics Slack integration to keep your team informed. Automate KPI updates with Slack to streamline your reporting processes. With these integrations, you can receive daily snapshots of your e-commerce performance, keeping you on top of your business metrics.

Custom Reporting and Analytics

Utilize our custom reporting capabilities to create tailored reports for your specific business needs. Whether it’s Shopify customer behavior analysis, BigCommerce performance analytics, or Etsy product analytics, our tools provide the flexibility and precision required for in-depth analysis. Create an e-commerce analytics dashboard that tracks key metrics and provides insights into your business performance.

Practical Examples

Imagine running a Shopify store and needing to analyze customer behavior. With our advanced calculations, you can segment customers based on purchase history and engagement metrics. Use the data to enhance your marketing strategies and improve customer satisfaction. For BigCommerce users, generate detailed sales tax reports and monitor performance analytics to ensure compliance and optimize business operations.

Conclusion

Our new custom multi-column pivot reports and advanced calculation capabilities are designed to empower you with greater analytical depth and flexibility. By leveraging these tools, you can transform your data into actionable insights, drive better decision-making, and achieve your business objectives with confidence.

We’re committed to continuously improving our platform to meet your evolving needs. Stay tuned for more exciting updates, and as always, we welcome your feedback to help us shape the future of data analysis. Click here to learn more.

February Updates : Enhancing Your E-commerce Capabilities:

Introduction

As we move into February, we’re thrilled to announce a series of significant updates to our eCommerce platform. These enhancements are designed to streamline your data integration, reporting, and overall eCommerce performance. Here’s a detailed look at what’s new:

API Integration for Seamless Data Management

We are excited to introduce a new option that allows you to integrate your data via our API. This feature empowers you to connect our platform with your custom store effortlessly, providing a streamlined data management experience. Whether you’re using Shopify, BigCommerce, or another eCommerce platform, this API integration ensures that your data flows smoothly, enabling better eCommerce performance analytics.

PayHelm Integration with Custom Stores

In addition to our API integration, we’ve made it easier to integrate PayHelm with your custom store. PayHelm is known for its powerful analytics capabilities, offering insights into your sales, taxes, and customer behavior. Now, you can leverage PayHelm’s analytics directly within your custom eCommerce setup, enhancing your eCommerce analytics dashboard and giving you a more comprehensive view of your performance metrics.

Custom Timeframe Comparison

Understanding trends and performance over time is crucial for making informed business decisions. Our new feature allows you to compare custom timeframes, giving you the flexibility to analyze specific periods that are most relevant to your business. This addition to our eCommerce performance dashboard lets you pinpoint trends and anomalies, providing deeper insights into your eCommerce metrics.

Walmart Marketplace Support

Expanding your reach to multiple marketplaces is a key strategy for growth. We’re excited to announce support for Walmart marketplaces, allowing you to connect metadata and import orders seamlessly.This integration not only simplifies your multi-channel management but also enriches your eCommerce analytics with data from one of the largest retail platforms. Track your Walmart sales alongside your other channels in your eCommerce dashboards, ensuring a unified view of your business.

Enhanced CSV Export Options

Exporting your data for offline analysis or sharing with your team is now more convenient. Our CSV export functionality has been upgraded to include an option to have the export emailed to you upon completion. This means you no longer need to wait for large exports to finish—you can continue working on other tasks and receive your data directly in your inbox. This feature is especially useful for generating eCommerce reports and sharing them with stakeholders without any hassle.

Leveraging These Updates for Better Analytics

With these new features, you can significantly enhance your eCommerce analytics capabilities. Here are some specific ways these updates can benefit your business:

  • Ecommerce Metrics Dashboard: Integrate data from various sources using our API, giving you a comprehensive view of your eCommerce metrics.
  • Shopify Reporting and Customer Analytics: Utilize PayHelm’s integration to gain deeper insights into your Shopify store’s performance, from sales tax reports to customer behavior analysis.
  • BigCommerce Sales Tax Reporting: Simplify tax management and reporting with improved data integration and custom reporting capabilities.
  • Etsy and Google Analytics Integration: Track and analyze your Etsy sales data more effectively by integrating it with Google Analytics, now made easier with our enhanced export options.
  • Slack Data Analytics: Keep your team updated with the latest metrics by connecting your eCommerce data to Slack. Receive real-time notifications and reports, ensuring everyone is on the same page.

Conclusion

These February updates mark a significant enhancement in our platform’s capabilities, providing you with more robust tools to manage and analyze your eCommerce data. The new API integration, PayHelm support for custom stores, custom timeframe comparison, Walmart marketplace connectivity, and enhanced CSV export options are all designed to streamline your operations and offer deeper insights into your business performance.

By leveraging these new features, you can improve your eCommerce metrics dashboard, gain detailed insights into customer behavior, manage sales tax more efficiently, and stay updated with real-time analytics in Slack. Whether you’re using Shopify, BigCommerce, Etsy, or multiple platforms, these updates are tailored to help you optimize your strategies, drive growth, and achieve greater success.

Unleash the Power of Amazon Marketplace Analytics with PayHelm

Introduction

In the bustling world of e-commerce, mastering the intricacies of platforms like Amazon can mean the difference between thriving and merely surviving. As a seller, understanding your sales data, customer behavior, and inventory trends is paramount to making informed decisions that drive growth. That’s where Amazon Marketplace Analytics comes into play, and with PayHelm’s innovative integration, sellers can delve deeper than ever before into their Amazon account data.

Connecting Amazon with PayHelm

Picture this: You’re a seller on Amazon, navigating the complexities of inventory management, pricing strategies, and customer engagement. While Amazon provides a wealth of data through its Seller Central platform, deciphering and leveraging this information effectively can be daunting. Enter PayHelm, a game-changing tool that seamlessly connects your Amazon account to powerful analytics tools, unlocking a treasure trove of insights.

By integrating your Amazon account with PayHelm, sellers gain access to a comprehensive suite of analytics capabilities that go far beyond the basics. From analyzing orders and identifying top-performing products to understanding customer preferences and monitoring inventory changes, PayHelm empowers sellers to make data-driven decisions with confidence.

Unveiling the Power of Analytics

In addition, what exactly can sellers expect when they harness the power of Amazon Marketplace Analytics through PayHelm? Let’s break it down.

Order Analysis:

PayHelm enables sellers to delve deep into their order data, allowing them to identify trends, track sales performance, and uncover valuable insights into purchasing patterns. By understanding which products are driving revenue and which ones may need a boost, sellers can fine-tune their strategies for maximum impact.

Top Customers:

Knowing your top customers is key to fostering loyalty and maximizing lifetime value. With PayHelm, sellers can easily identify their most valuable customers, analyze their buying behavior, and tailor personalized experiences to enhance engagement and drive repeat business.

Inventory Analytics:

Effective inventory management is essential for maintaining a healthy bottom line. PayHelm equips sellers with advanced inventory analytics, enabling them to track stock levels, monitor inventory turn rates, and optimize replenishment strategies to prevent stockouts and minimize excess inventory.

Stock Out Sales Adjusted Velocity:

Understanding the impact of stockouts on sales velocity is crucial for mitigating lost revenue and optimizing inventory levels. PayHelm’s stock out sales adjusted velocity feature provides sellers with actionable insights into how stockouts affect sales performance, allowing them to make informed decisions to minimize disruptions and maximize profitability.

Inventory Changes:

From fluctuations in demand to unexpected supply chain disruptions, staying on top of inventory changes is essential for maintaining operational efficiency. PayHelm’s inventory change tracking capabilities enable sellers to monitor inventory movements in real-time, empowering them to adapt quickly to evolving market conditions and mitigate potential risks.

Inventory Turn:

Inventory turn, or the rate at which inventory is sold and replaced within a given period, is a key metric for assessing operational efficiency and liquidity. PayHelm provides sellers with visibility into their inventory turn rates, allowing them to identify opportunities for optimization and streamline their inventory management processes for greater profitability.

Conclusion

In the fast-paced world of e-commerce, data is key. By connecting your Amazon account to PayHelm and leveraging the power of Amazon Marketplace Analytics, sellers can gain a competitive edge by making informed decisions that drive growth. Maximize profitability, and delight customers. From analyzing orders and identifying top customers to optimizing inventory management and monitoring stockout impacts, PayHelm empowers sellers to unlock the full potential of their Amazon business. Start up now and enjoy.Connect with PayHelm today and take your Amazon sales to new heights!

December 2023 Product Update: Elevate Your Ecommerce Strategy with Advanced Analytics and Integration

Introduction:

The world of ecommerce is ever-evolving, and staying competitive means leveraging the latest tools and integrations. Our December 2023 product update is designed to provide you with cutting-edge features that enhance your ecommerce performance analytics and streamline your operations. This update includes advanced filtering and reporting on guest checkouts, a powerful ChatGPT integration, and comprehensive inventory analysis across multiple platforms. Let’s explore these features in detail and see how they can transform your ecommerce business.

Filter & Report on Guest Checkouts: A Deeper Understanding of Customer Behavior

Understanding customer behavior is crucial for any ecommerce business. Our new feature enables you to filter and report on guest checkouts, providing a clear distinction between guest and registered user transactions. This enhancement to our ecommerce analytics dashboard offers deeper insights into your customer base, allowing you to tailor your marketing strategies more effectively.

Key Benefits:

  1. Enhanced Customer Insights: By segmenting guest versus non-guest checkouts, you can gain valuable insights into shopping behaviors and preferences. This is particularly useful for platforms like Shopify and BigCommerce, where customer experience is paramount.
  2. Improved Conversion Strategies: Identifying trends and patterns in guest checkouts can help you implement targeted strategies to convert these guests into repeat customers, thereby enhancing customer loyalty and retention.
  3. Optimized Marketing Campaigns: By analyzing guest checkout data, you can tailor your marketing efforts to address the unique needs of this customer segment, potentially increasing your overall sales and customer satisfaction.

For example, our ecommerce performance dashboard now includes specific metrics focused on guest checkout behavior. This feature integrates seamlessly with your existing ecommerce analytics tools, such as Google Analytics, providing a comprehensive view of your ecommerce performance.

ChatGPT Integration: Conversational AI for Business Insights

Harness the power of conversational AI with our new ChatGPT integration. This feature allows you to interact with ChatGPT using your integration token, providing real-time business insights and support.

Key Benefits:

  1. Real-Time Business Support: Engage with ChatGPT to get instant answers to your business queries, whether it’s about your ecommerce analytics metrics or daily operational tasks.
  2. Enhanced Decision-Making: Use ChatGPT to analyze data trends and metrics from your ecommerce dashboards, helping you make informed decisions quickly.
  3. Seamless Integration: This integration works with various platforms, including Slack, enabling you to get KPIs and reports directly in your preferred communication channels.

Imagine asking ChatGPT for your daily sales performance analytics or inventory depletion rates and getting instant, actionable insights This level of interaction can significantly streamline your operations and improve your business performance.

Comprehensive Inventory Analysis: Stay Ahead of Your Stock

Managing inventory across multiple platforms can be challenging. Our latest update simplifies this process by providing a unified view of your inventory across Amazon, BigCommerce, Shopify, and more. With the introduction of Stock Out Adjusted Sales Velocity, you can make more accurate inventory predictions and avoid stockouts.

Key Benefits:

  1. Unified Inventory View: Get a consolidated view of your inventory across different platforms, ensuring you have the right products available at the right time.
  2. Accurate Sales Velocity: Our Stock Out Adjusted Sales Velocity metric helps you understand the true demand for your products, taking into account periods when items were out of stock.
  3. Optimized Inventory Management: Use these insights to adjust your inventory levels proactively, reducing the risk of stockouts and overstock situations.

For businesses utilizing ecommerce platforms like Etsy, Shopify, and BigCommerce, this feature is a game-changer. It integrates with your existing ecommerce reporting dashboards, providing a holistic view of your inventory data and performance analytics.

Conclusion: Elevate Your Ecommerce Strategy

The December product update is designed to provide you with the tools and insights needed to stay competitive in the dynamic world of ecommerce. By leveraging enhanced guest checkout reports, integrating with ChatGPT for real-time business insights, and utilizing comprehensive inventory analysis, you can make informed decisions that drive growth and efficiency.

Stay ahead of the curve with our advanced ecommerce performance analytics, and transform the way you manage your online business. Embrace these new features and see the difference they can make in your ecommerce journey.

Nov 2023 Updates: Elevating Ecommerce Analytics and Performance Tracking

Introduction

As we step into the new year, our commitment to enhancing ecommerce performance analytics remains steadfast. January’s releases bring a suite of powerful features designed to provide deeper insights, improve data accessibility, and streamline operations. In this blog post, we’ll explore these updates, focusing on the new CSV export options, the addition of 50+ metrics across various reports, and the integration of Omnisend and Klaviyo Attribution & Analytics. Additionally, we’ll discuss how you can now combine multiple orders into one insured package, optimizing your shipping process.

CSV Export Options for Seamless Data Handling

One of the standout features of this month’s update is the ability to export data in CSV format and have it emailed directly to you once the export is complete. This feature is designed to simplify data handling, allowing you to easily access and share critical information without manual downloads. Whether you’re tracking ecommerce performance analytics or preparing comprehensive reports, this new option ensures that your data is readily available and easily manageable.

Expanding Your Analytical Horizons with 50+ New Metrics

Understanding and optimizing your ecommerce performance requires robust metrics. To this end, we’ve introduced over 50 new metrics across Customer Report, Product Report, Marketing Report, and more. These metrics are designed to provide a granular view of your ecommerce performance, helping you make data-driven decisions to drive growth.

  • Customer Report: Gain deeper insights into customer behavior, lifetime value, and retention rates.
  • Product Report: Track product performance, including top-selling items, inventory levels, and product returns.
  • Marketing Report: Analyze the effectiveness of your marketing campaigns, including conversion rates, ROI, and customer acquisition costs.

These comprehensive metrics make our ecommerce analytics dashboard one of the best ecommerce dashboards available, providing you with the tools you need to succeed in a competitive market.

Omnisend and Klaviyo Attribution & Analytics

Marketing attribution is crucial for understanding which channels and campaigns are driving your sales. This month, we’ve integrated Omnisend Attribution & Analytics into our Marketing Attribution Reports. This integration allows you to see which clicks come from email campaigns and track views, opens, and click-through rates. By ensuring your attribution aligns accurately, you can optimize your marketing strategies for better results.

In addition, we’ve also added Klaviyo Attribution & Analytics to our Marketing Attribution Reports. This integration supports multiple Klaviyo accounts connected to multiple stores, providing a holistic view of your email marketing performance. Like Omnisend, Klaviyo’s integration enables you to see detailed metrics on email interactions, helping you fine-tune your campaigns for maximum impact.

These integrations make our ecommerce marketing dashboard a powerful tool for analyzing and optimizing your marketing efforts, ensuring that you can track and improve your ecommerce sales performance analytics effectively.

Combining Multiple Orders into One Insured Package

Shipping and logistics are critical components of ecommerce operations. To enhance efficiency and customer satisfaction, we’ve introduced a feature that allows you to combine multiple orders into one insured package. This capability not only reduces shipping costs but also simplifies the tracking process for both you and your customers.

By consolidating shipments, you can streamline your logistics, reduce the risk of lost or damaged packages, and provide a better overall customer experience. This feature is especially beneficial for businesses with high order volumes, offering a practical solution for managing ecommerce performance and improving operational efficiency.

Leveraging the Power of Comprehensive Reporting

Our updates this month also enhance the capabilities of custom reports. With the ability to export data, track new metrics, and integrate advanced attribution tools, our custom reports provide a comprehensive view of your ecommerce performance. Whether you’re using our ecommerce analytics software for Shopify reporting, Etsy analytics, or BigCommerce sales tax reports, these new features ensure that you have the data you need to make informed decisions.

Conclusion

January’s updates mark a significant step forward in our mission to provide the most advanced and user-friendly ecommerce analytics dashboard on the market. With new CSV export options, an expanded array of metrics, and enhanced marketing attribution integrations, we are empowering businesses to gain deeper insights, optimize their performance, and drive growth.

Whether you’re focused on ecommerce business performance analytics, marketing effectiveness, or operational efficiency, our latest features are designed to support your success. As we continue to innovate and expand our offerings, we look forward to helping you achieve your ecommerce goals in the coming year.

Stay tuned for more updates and enhancements, and as always, we welcome your feedback and suggestions to help us improve our services. Here’s to a successful and data-driven 2024